

An infrastructure team ran production across four time zones. I was there for the delivery numbers: production incidents, alarm volume, backlog.
The delivery board told one story. The team, asked one by one, told another. The NPS was minus 15.
The first measurement
I brought an instrument I run on my engagements: the Voice of Employees. It takes the same discipline I apply to customers, pointed at the team itself, once at the start of the project and once at the end. I ran it with an internal coach I was training to carry the method.
We ran individual conversations with every engineer, anonymous by contract, scored the way you score customers: promoters minus detractors.
Why “boost morale” doesn’t work
The standard response to a number like that is a program: the annual HR survey, an offsite, a recognition scheme.
All of them aim at the wrong layer. Morale is an output, not a mood you can lift directly. Behind a negative team NPS, you will find system defects wearing an emotional costume: no onboarding standard, no handover design, no priority rules, no shared hours across time zones. You cannot team-build your way out of a broken handover. The instrument’s job is to make those defects speakable, then fixable.
The instrument
Define the themes first, before writing a single question. The themes are what you commit to hearing about, including the answers you will not like. Here are the five I use, and what each one listens for.
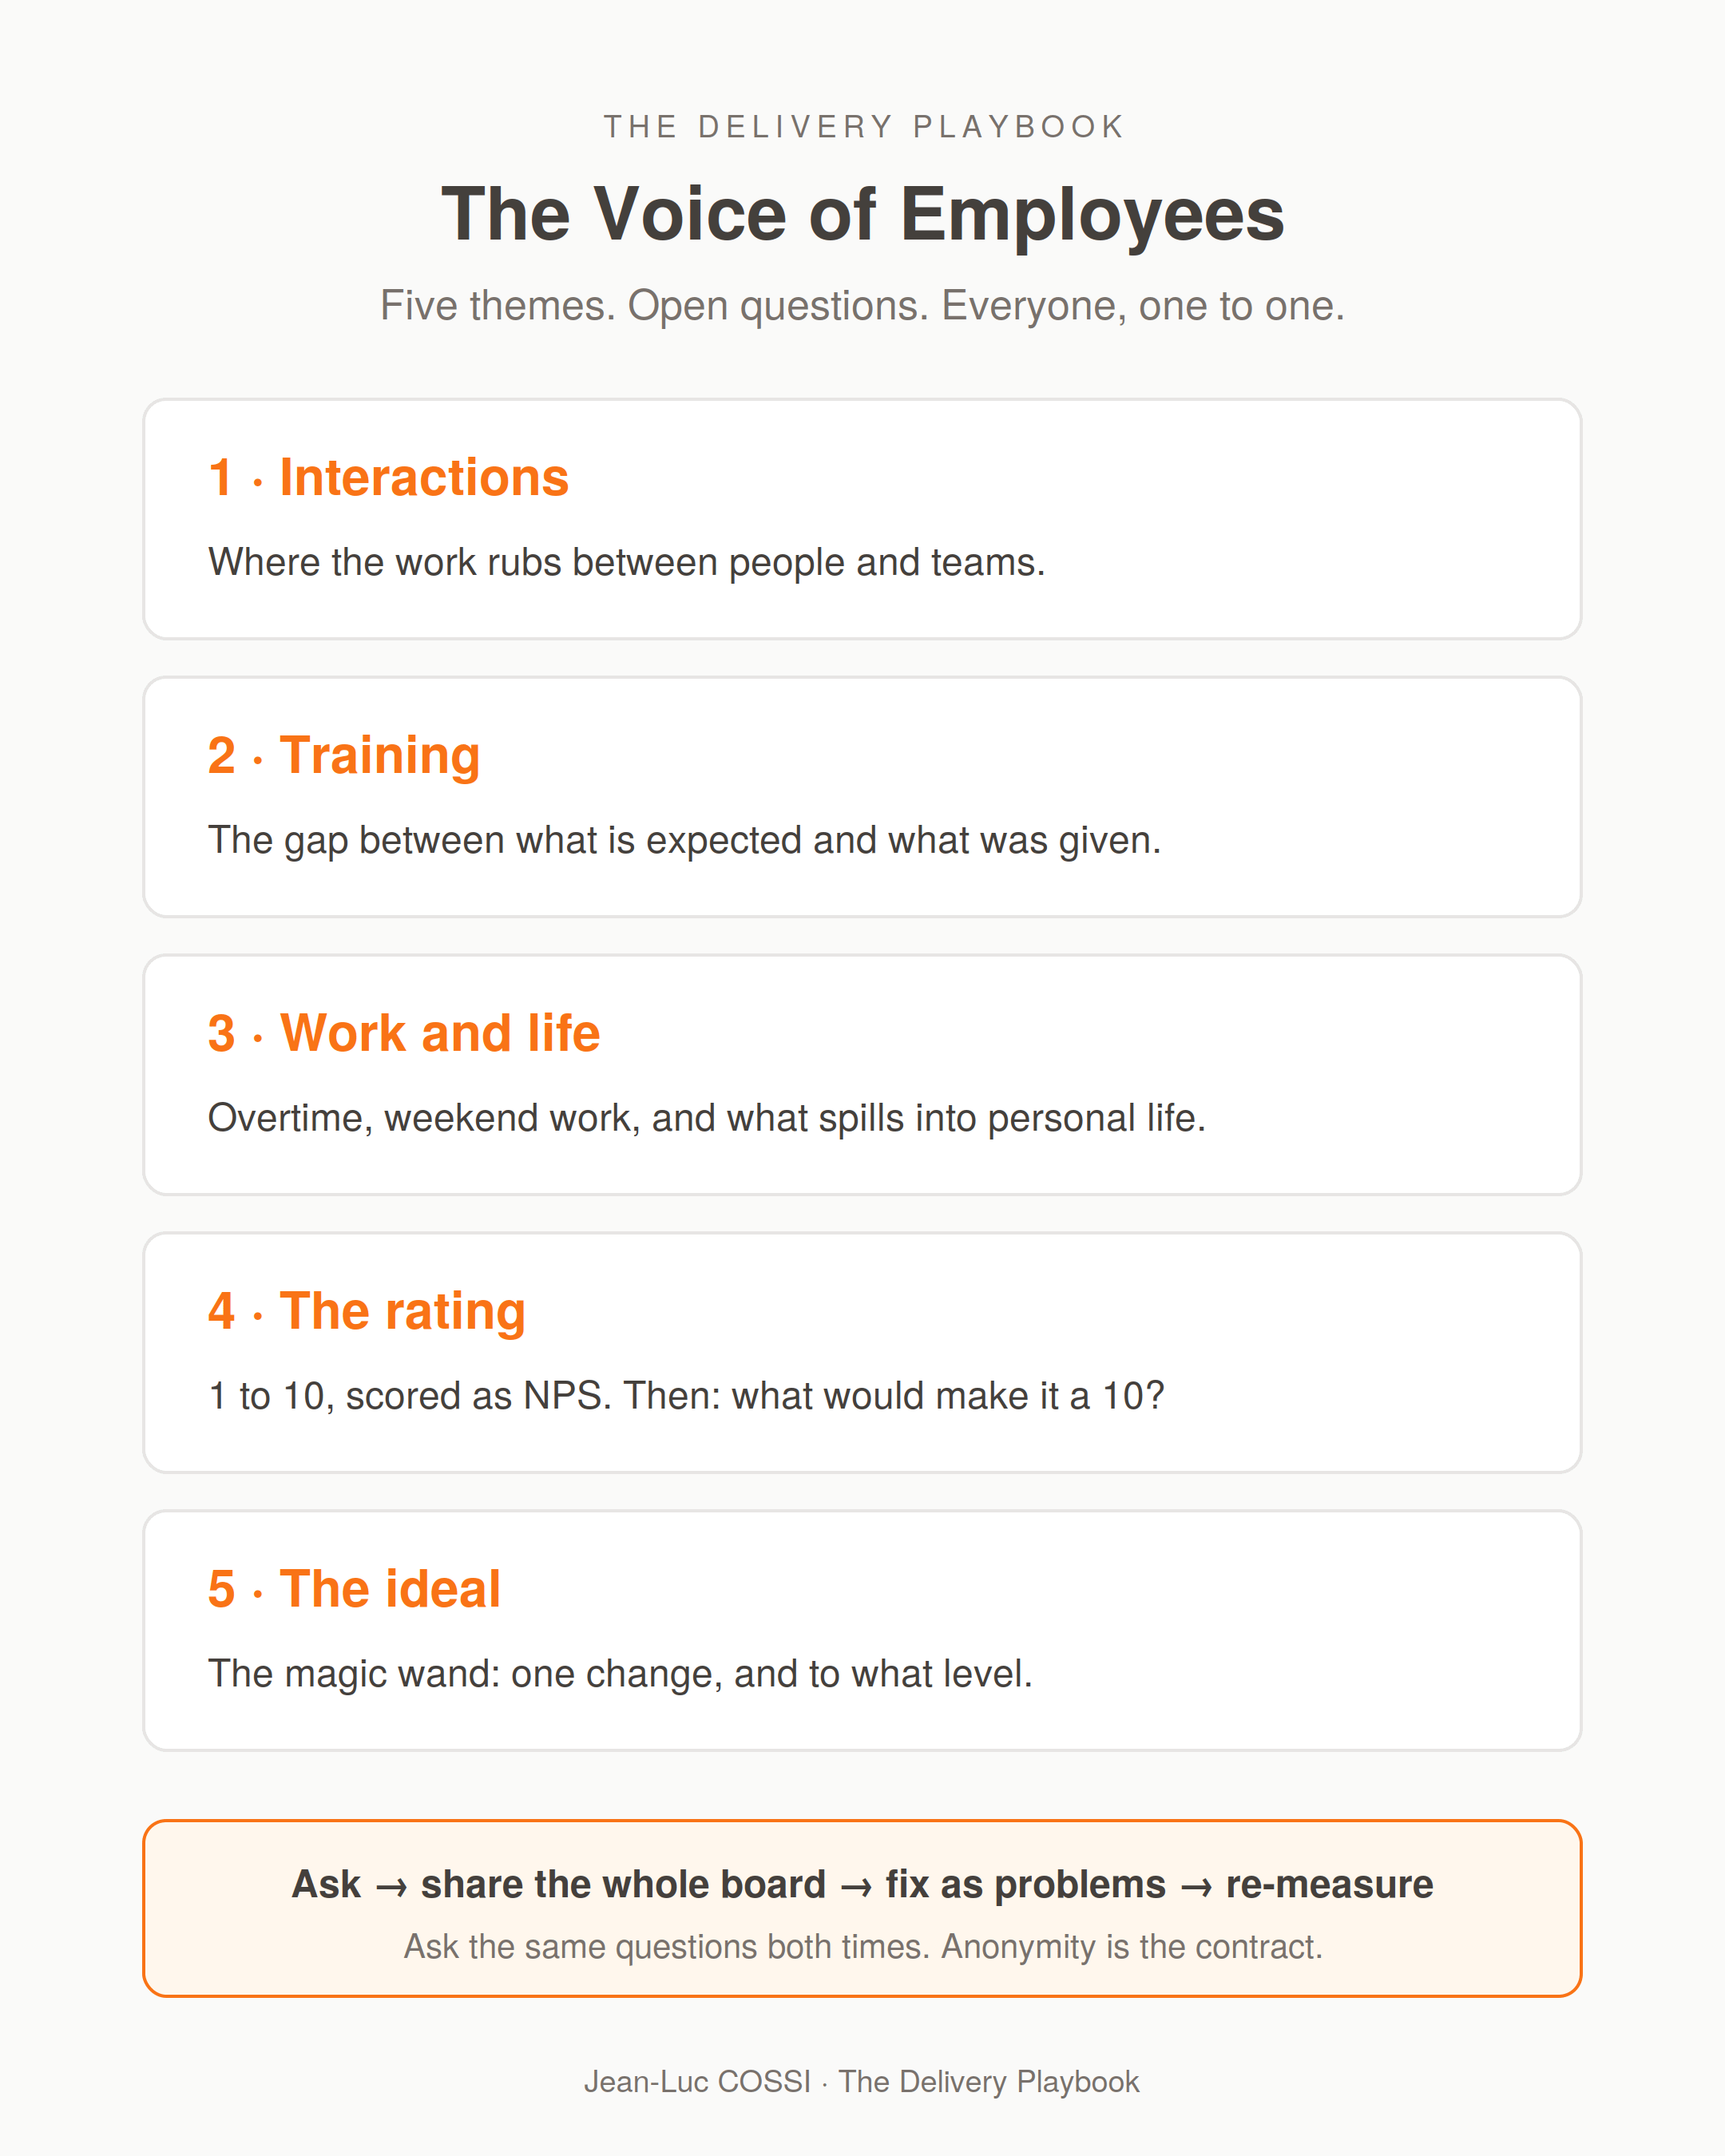
Interactions. Where the work rubs between people: other teams, users, or project managers. Friction here is almost never personal; it is structural, and this theme is where handover and boundary problems surface first.
Training. The gap between what the company expects of someone and what it has actually given them. Onboarding debt lives here, and it is invisible on every delivery dashboard.
Work and life. The overtime, the weekend interventions, or the always-running feeling. This theme counts what the job spills into people’s evenings and weekends, which no delivery dashboard will ever show you.
The rating. The score itself, 1 to 10, computed as an NPS. Then the question that matters more than the score: what would it take to make it a 10? The answers to that question are your improvement plan, written by the team.
The ideal. The magic wand: the one thing they would change, and to what level. It reveals priorities no ranking exercise will give you.
Now the methodology hint that decides whether the instrument works: assess every theme with open questions. Open means no question that a yes or a no can answer, and no question that suggests its own answer. You are fishing for real examples and stories, because examples carry the system defect with them, and opinions do not. Two questions I used on that engagement, verbatim from my guide: “Who were the last five people you interacted with? Were any of those interactions complicated? Walk me through one.” And on work and life: “How much overtime did you do last week?” Last week, specifically. Ask about overtime in general, and you get a shrug. Narrow it to last week, and the shrug becomes a number.
Run the same questions with every engineer, one-to-one, with anonymity guaranteed. A team of twenty means twenty conversations. Do not use a survey link, it is not the same instrument.
Consolidate the verbatims into weighted themes, positive and negative both, and compute the NPS from the ratings. Share the whole board with the whole team, names removed, nothing softened. Then put the top negative themes on the delivery board as problems, next to incidents and lead time, and run them through the same problem-solving cycles as everything else.
At the end of the project, re-measure, keeping the themes, the questions, and the method identical to the first round, because changing anything breaks the comparison. The instrument earns trust the day people see their words turn into countermeasures.
The second measurement
At the end of the project, we ran the same conversations again. The NPS had moved 65 points, from minus 15 to plus 50. On the delivery board, the delivery numbers I was there for had moved too. Production incidents had halved.
The why is not a mystery. What moved was, almost line for line, what the team had said would make them a 10. Their answers had been posted as the improvement plan, and the plan had been worked on like any other problem on the delivery board. Nobody shipped a rewards scheme or organized an offsite. The system got fixed, and the number that looks like a feeling moved with it.
The second measurement still carried negative themes. Knowledge transfer had broken when a senior engineer left, and the team said so bluntly. The asks that remained were structural: coverage, knowledge, and workload. Recognition came last.
Read that carefully. At plus 50 NPS, the team did not go quiet. It got more precise. A trusted voice sharpens, it does not soften. Plus 50 is not a happy team. It is a team that tells you exactly where the next problem is.
The pattern
That minus 15 was a list of things broken in how the team worked, and every engineer could name them the day someone asked. They can describe that system with precision the day you ask individually, anonymously, and show them what you heard. The description is not the result here. It is the raw material of the improvement plan.
In 2026, the tools make your team faster while the burnout number stands still, exactly as DORA measured. So measure the voice of the engineer next to the lead time. It reads the system from the side your dashboards cannot see.
If you want to try this, sit down with each engineer before your next big delivery push and put what they tell you next to your lead time numbers.