

I observe engineering teams at work. It is the way I see where the work actually breaks. Here, I was in the room but could not tell who was working on what.
A team of fifteen testers was working on an insurance claims platform. There was nothing anywhere to say which delivery or feature was behind or where the work had stalled. The client had just returned a version carrying seven regressions that were supposedly fixed months earlier, and the manager wanted to know why his team could not keep pace.
I pulled the defect data. Of every hundred defects the team sent back to development, forty-four came back rejected. Almost half of what that team produced created work for other people and closed nothing.
I continued to watch testers at work for a few days. Some ran the same test again and again without reaching a conclusion. One spent two hours investigating before telling anyone.
I needed to dive into the defect data. I took ten rejected reports and read them one by one.
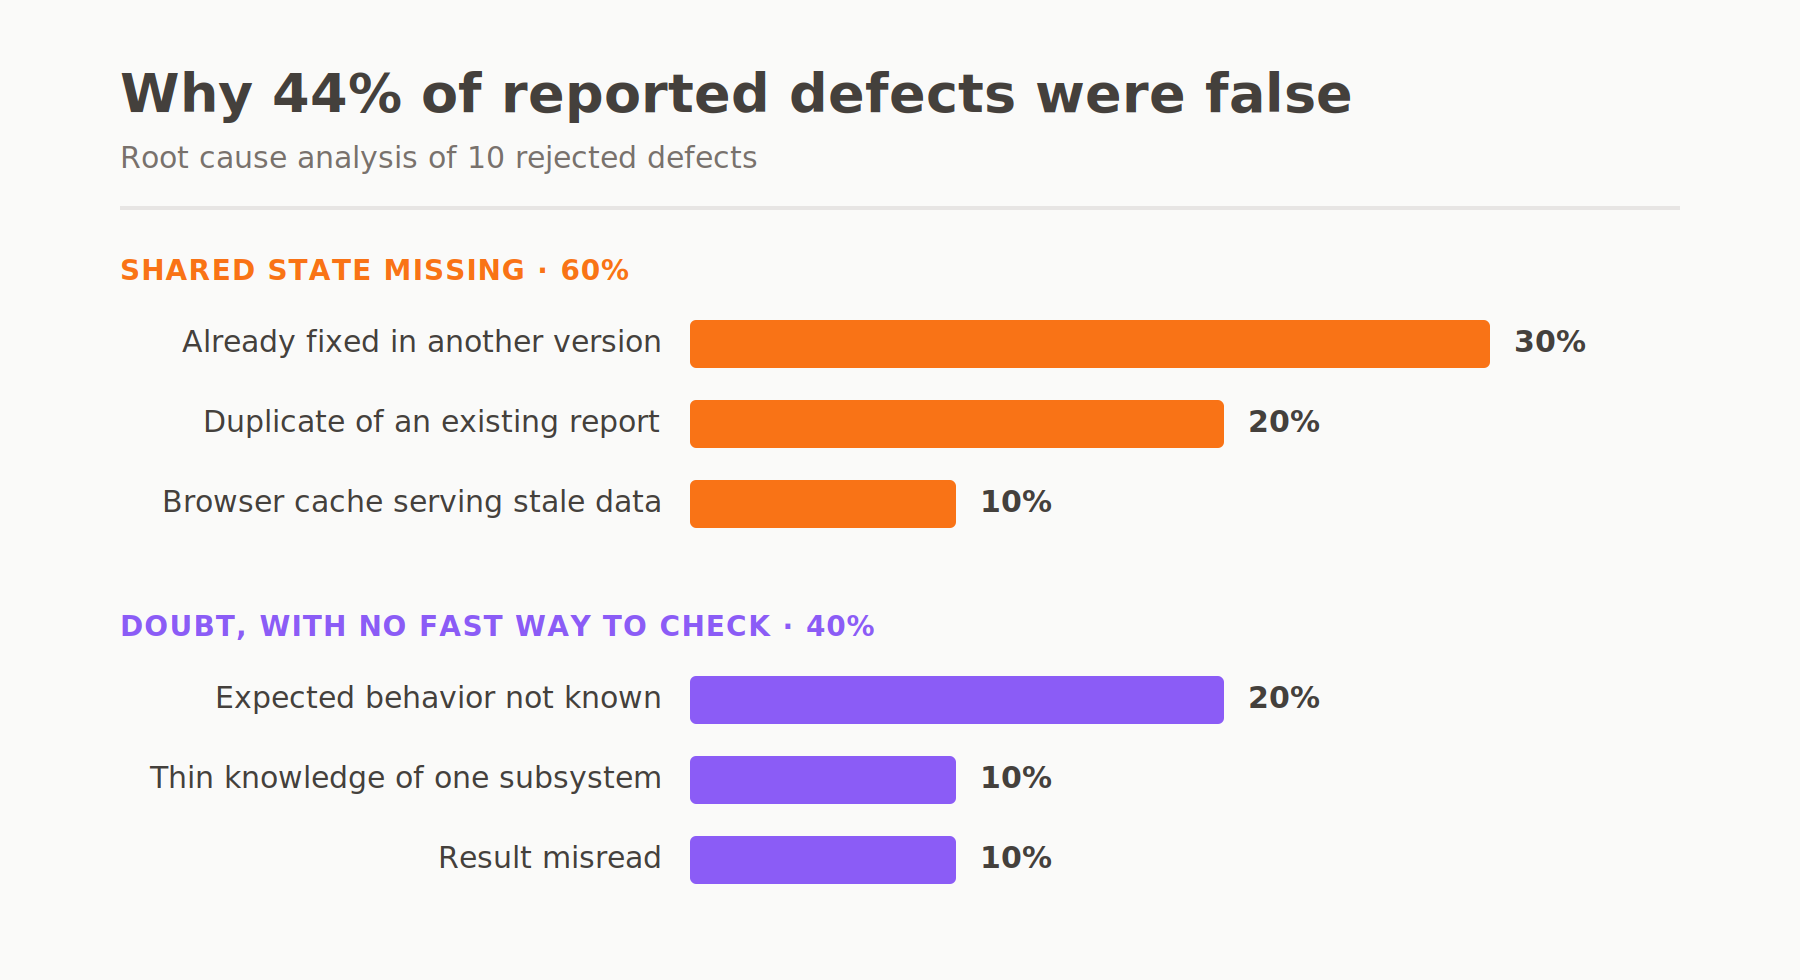
Thirty percent were real bugs, already fixed in a version the tester did not have. Twenty percent were duplicates of reports nobody could see. Twenty percent came from testers who did not know the expected behavior and had no quick way to confirm it. The rest was smaller: a thin knowledge of one subsystem, a misread result, a browser serving pages from cache.
Every cause on that list is a missing piece of shared information.
The usual countermeasure here is a review gate: someone senior checks each report before it is filed. But here, it fails, because it puts a queue in front of a problem that was never about carelessness.
With the team manager, the move we made is an “andon”. It is a signal that stops the work and calls for help. For that, we set one basic rule: when you are unsure something is a bug, you do not file it. Instead, you raise the signal, and the functional expert walks to your desk and looks at the screen with you. The typical resolution we observed was five minutes.
Two design choices decide whether this holds or becomes one more interruption.
Raising the signal is a requirement. Permission is not enough, because filing a ticket is free, but saying “I am not sure” might not be.
The expert also treats every call as twenty minutes of teaching. He shows the expected behavior and why. Then he shows you how you verify it yourself next time. So the same doubt stops coming back.
The andon reaches three of those six causes, roughly forty percent of the false reports. Asking an expert cannot refresh a stale environment or reveal a duplicate. The other sixty percent closed because the team built a visual management system. Every lot, delivery date, and problem already reported sat in one place anyone could read, with a target for the day. When the actual fell short of the target, that gap started a problem-solving cycle. That wall was empty the day I arrived.
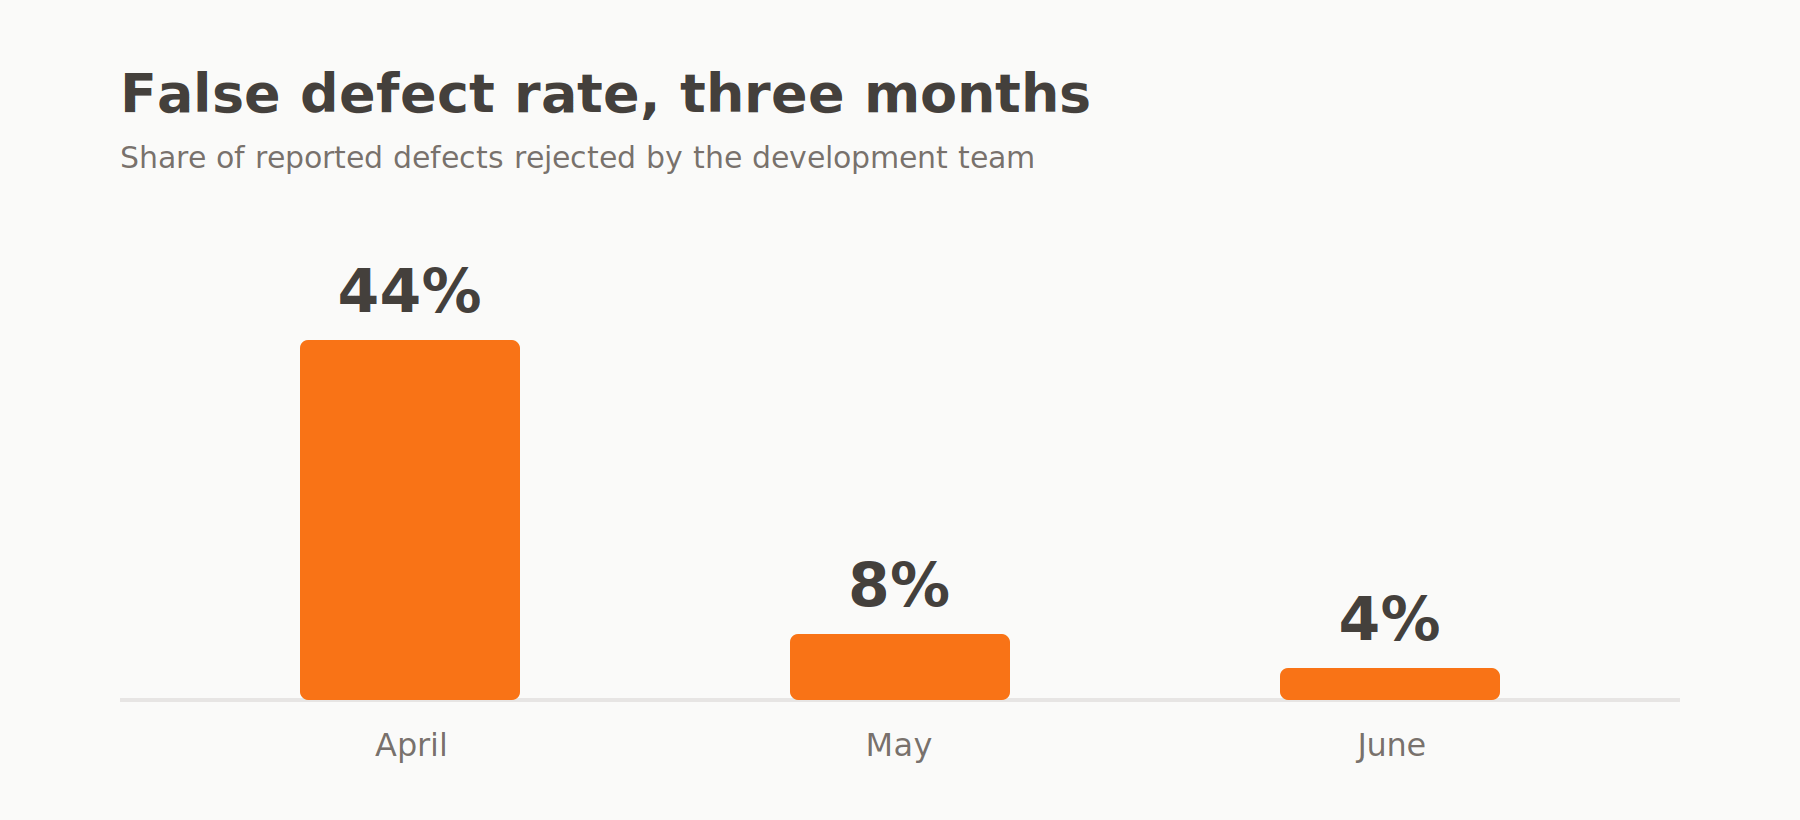
April, 44%. May, 8%. June, 4%. There was no new headcount over those three months. The one thing added was the functional expert’s time, and he did not stay for the whole run.
The full root cause analysis and the problem-solving cycles behind these numbers are in the case study.
What your team reports is not a measure of how carefully they work. It is a measure of what they can see at the moment they have to decide. Fix what they can see, and the number moves on its own.
If you want to see where your own system leaks, the Delivery Scorecard takes two minutes. Ten questions, and you know where to look first.